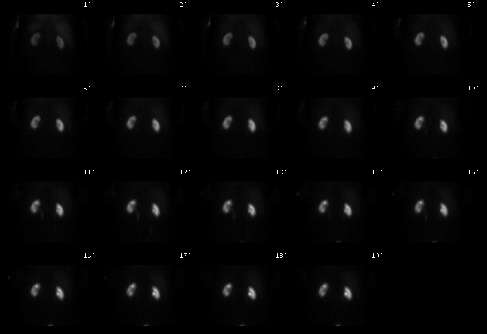

Dynamic posterior renal images (one minute per image for 20 minutes)
View main image(rs) in a separate image viewer
View second image(rs). Posterior renal flow (4 seconds per image)
View third image(rs). Renogram curve and split function
View fourth image(rs). Static posterior image at 25 minutes
Full history/Diagnosis is available below
The split renal function is within normal limits. The right kidney contributes 54% and the left kidney 46% of total renal function.
Although the scintigraphic findings are consistent with symmetric renal injury (e.g. acute tubular necrosis), the clinical history did not suggest any reason for substantial decline in renal function. Since the prior exam, the patient had no episodes of hypotension, nephrotoxic agents, etc.
Upon further questioning, the patient had been NPO for over 12 hours and no pre-test hydration had been given.
It is important to hydrate all patients undergoing renal scintigraphy. Often times, the patient is dehydrated because they assume or have been (inappropriately) told that they should be NPO past midnight. At our institution, the procedure manual states that the patient should receive 16 ounces (or 500 ml) of oral liquids (ideally water) before beginning the study. However, this requires extra time and vigilence on the part of the technologist, which is not always a simple matter, especially in a busy Nuclear Medicine Department.
As seen in this case, a dehydrated patient with normal renal function can have a very abnormal appearing renal scan. The normal response of the kidney in the pre-renal state is to conserve fluids and thus decrease renal excretion.
Compared with the pre-hydration image, the post-hydration image clearly shows significant wash-out of tracer. Therefore, this study was interpreted as normal in the setting of patient dehydration.
View followup image(rs). Posterior static images pre- and post-hydration, scaled to show true change in renal activity.
2) Care must be taken in comparison of static images to assess interval change. It is best if the images are acquired for the same amount of time and into the same size digital matrix. Upon display, the images must be scaled to a common maximum. If the two images were filmed such that each image was scaled to its own maximal pixel count (commonly done by some nuclear medicine systems), the kidneys would appear similar in intensity, erroneously suggesting that no washout had occurred.
In this case, both the pre- and post-hydration images were acquired for two minutes. The maximum pixel count is 414 on the pre-hydration image and 177 on the post-hydration image. When displaying the two images, both were scaled the same maximum pixel count (414 in this case) in order to visually appreciate the absolute decrease in renal counts on the post-hydration image.
1) Medical renal disease (Need to correlate with the patient's creatinine. Also, one would not expect such improved tracer excretion with hydration.)
2) Acute tubular necrosis
3) Obstruction (One would expect to see associated hydronephrosis, and likely have better parenchymal clearance of tracer unless obstruction was quite high grade.)
4) Dehydration
References and General Discussion of Renal Scintigraphy (Anatomic field:Genitourinary System, Category:Normal, Technique, Congenital Anomaly)
Return to the Teaching File home page.