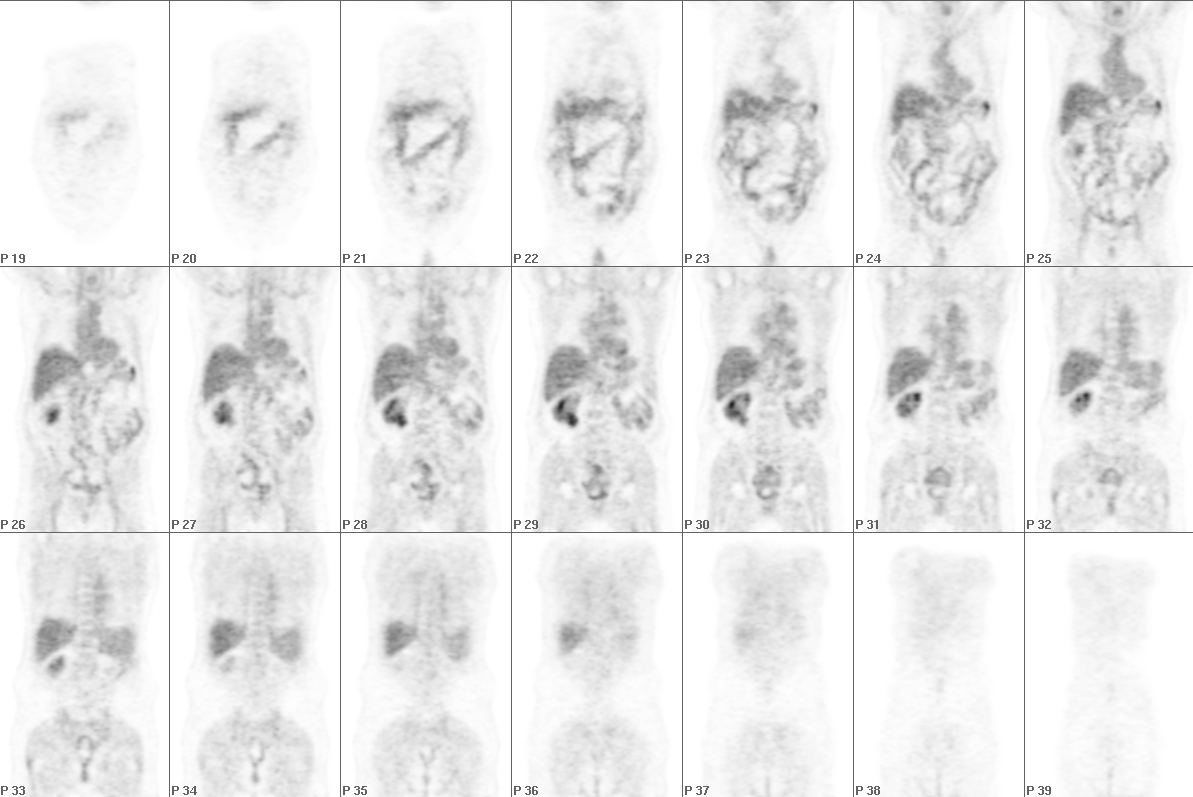

Coronal FDG-PET Images
View main image(pt) in a separate image viewer
View second image(pt). Coronal, Axial and Sagittal FDG-PET Images Through the Area of Interest
View third image(ct). Selected Axial Computed Tomographic Images of the Abdomen
View fourth image(us). Longitudinal and Transverse Ultrasound Images of the Right Kidney
Full history/Diagnosis is available below
Selected axial CT images (third image) show low attenuation lesions in the liver corresponding to areas of decreased metabolism, consistent with cysts. An exophytic low attenuation lesion is noted at the lower pole of the right kidney.
Longitudinal and transverse ultrasound images (fourth image)confirm a hyperechoic solid mass in the lower pole of the right kidney.
A second study (Miyauchi et al., 1996) evaluating factors in the degree of FDG uptake in renal cell carcinoma (n = 11) demonstrated that patients with higher grade tumors had positive FDG-PET studies. The fact that many renal cell carcinomas are lower in grade may explain the relatively low sensitivity.
Another limitation with FDG-PET evaluation of renal cell carcinoma is the fact that FDG is excreted by the kidneys. Thus, variable degrees of increased uptake are normally seen in the renal parenchyma and collecting system, making detection of focal increased uptake in a tumor difficult. In this particular case, evaluation was simplified by the exophytic nature of the mass.
Reference: 1. Hoh CK et al., Positron Emission Tomography in Urological Oncology. J Urol. 1998;159(2):347-356.
2. Bachor et al., Positron Emission Tomography Diagnosis of renal cell carcinoma. Urology 1996; 35:146.
3. Miyauchi et al., Correlation between visualization of primary renal cancer by FDG-PET and histopathological findings. J Nucl Med (Suppl) 1966; 37:64.
References and General Discussion of PET Tumor Imaging Studies (Anatomic field:Genitourinary System, Category:Neoplasm, Neoplastic-like condition)
Return to the Teaching File home page.